
AT A GLANCE CD3 marks pan T cells, CD4/CD8 distinguish phenotypes within the T-cell compartment, and CD20 identifies B cells. Correct interpretation depends on knowing each population’s parent gate.
A PBMC profile can look straightforward until the percentages are read without their gates. CD3, CD4, CD8 and CD20 each answer a different immunophenotyping question, but their values are not interchangeable. In a mixed peripheral blood mononuclear cell (PBMC) sample, a marker’s meaning depends on the population being measured and the way the flow-cytometry analysis was gated.
This guide explains what the four markers tell you, how to interpret a representative rhesus monkey PBMC profile, and what to review when choosing PBMCs for immunology-focused research. It uses the available MileCell immune-cell characterization to illustrate practical, scientifically cautious reading of marker-defined populations.
CD45 and CD14 provide useful context. CD45 identifies leukocytes, while CD14 is associated with monocytes. These complementary readouts help distinguish broad PBMC composition from the CD3/CD4/CD8 T-cell analysis.
| Marker | Common interpretation | How to read it |
|---|---|---|
| CD3 | Pan T-cell marker | Used to identify the T-cell population before evaluating CD4/CD8-defined subsets. |
| CD4 | Helper T-cell-associated marker | Interpreted together with CD8 within the selected T-cell gate. |
| CD8 | Cytotoxic T-cell-associated marker | Interpreted with CD4; CD4/CD8 double-positive or double-negative events may also be recorded. |
| CD20 | B-cell marker | Shows the B-cell compartment in the relevant gated population; it is not a T-cell subset. |
The rhesus monkey example includes scatter-based selection and intermediate populations labeled R1, Cells and P1. Their reported values are 75.00%, 98.59% and 55.16%, respectively. These are displayed gate results, not a claim about overall post-thaw viability. Their importance is that subsequent marker percentages must be interpreted within the appropriate upstream selection.
The example reports CD3+ at 66.09% and CD20+ at 25.83%. Both are useful immune-composition readouts, but the illustrated plots use their own gate labels. Without verifying a shared parent gate, the two percentages should not be added or used to calculate a T-cell-to-B-cell ratio.
The CD4-versus-CD8 quadrant plot is specifically labeled within the CD3+ analysis. It reports CD4+CD8− at 64.97%, CD4−CD8+ at 30.00%, CD4+CD8+ at 2.89%, and CD4−CD8− at 2.14%. Read these as phenotypic fractions within that CD3+ gate, rather than as percentages of all PBMCs.
The characterization provides a concrete example of how a PBMC preparation can be mapped using pan-leukocyte, T-cell, B-cell and monocyte markers. The values below refer to this representative rhesus monkey PBMC sample; they are not universal specifications for other lots or species.
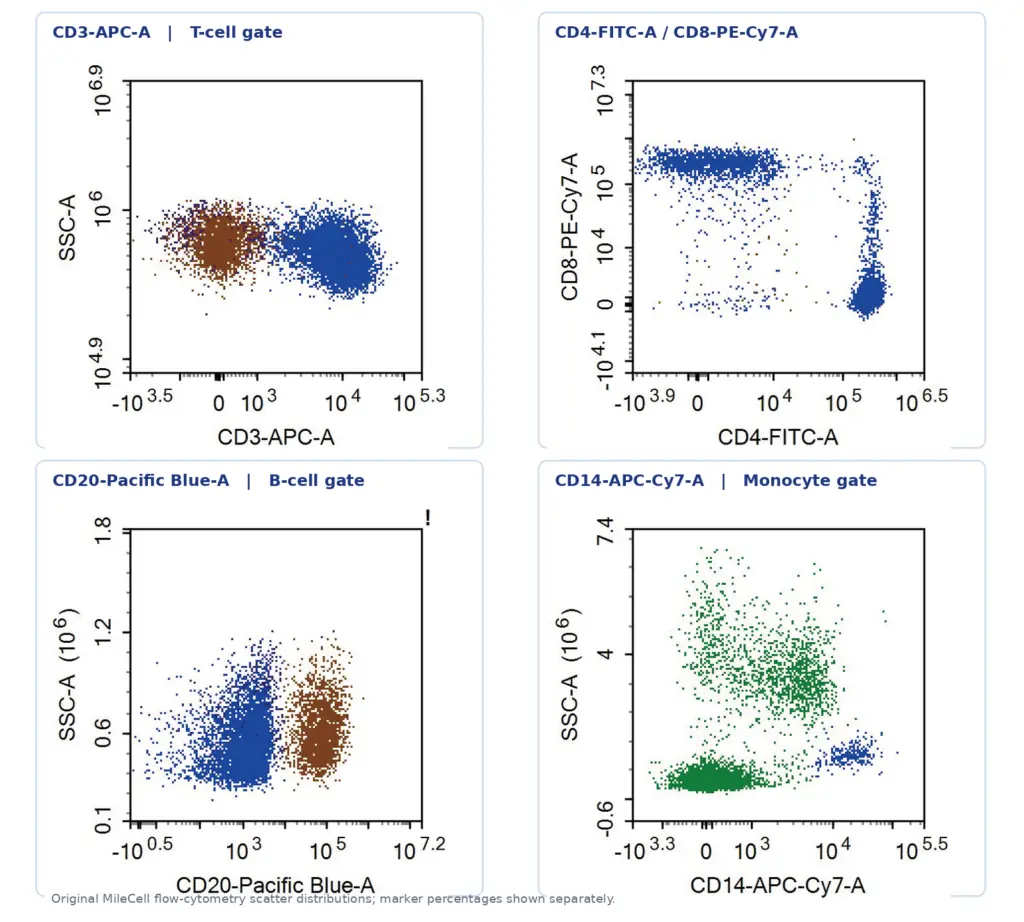
Figure 1. White-background scatter distributions extracted from the rhesus monkey PBMC characterization. Left-to-right, top-to-bottom: CD3, CD4/CD8, CD20 and CD14. Reported gate percentages are summarized in the table.
| Population | Reported value | Interpretation |
|---|---|---|
| CD45+ | 98.35% | Leukocyte-associated population |
| CD3+ | 66.09% | Pan T-cell-associated population |
| CD20+ | 25.83% | B-cell-associated population |
| CD14+ | 4.03% | Monocyte-associated population |
| CD4+CD8− | 64.97% | Within the CD3+ gate |
| CD4−CD8+ | 30.00% | Within the CD3+ gate |
| CD4+CD8+ | 2.89% | Within the CD3+ gate |
| CD4−CD8− | 2.14% | Within the CD3+ gate |
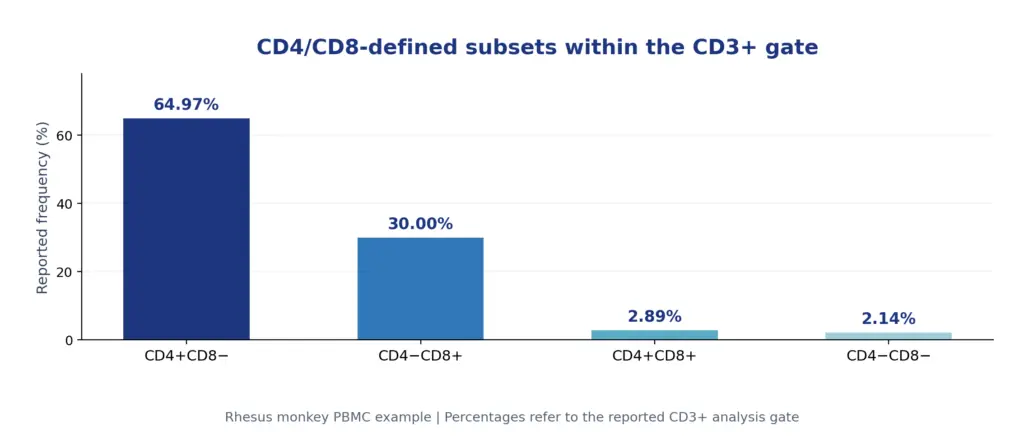
Figure 2. CD4/CD8 phenotype distribution within the reported CD3+ gate of the representative rhesus monkey PBMC sample. All values are reproduced from the characterized sample.
A high CD3+ fraction and a CD20+ fraction describe related but not necessarily identical denominators. Before comparing two values, verify the parent population and any exclusions applied to each plot.
An immunophenotyping result shows marker-defined composition. It does not, by itself, establish cytokine production, antigen responsiveness, cytotoxic activity or another functional endpoint. Functional claims require separate experimental readouts.
The data shown here describe rhesus monkey PBMCs in one characterized example. Mouse, rat, canine and other PBMC preparations may have different distributions. A specific study should use characterization for the selected species and, where available, the intended lot.
The four CD4/CD8 quadrant percentages are specific to the CD3+ analysis. They should not be presented as percentages of all PBMCs unless the dataset explicitly supports that denominator.
Selecting material for flow cytometry starts with the biological question and the species or strain used in the broader study. MileCell lists animal PBMC products across mouse, rat, non-human primate and other species, with the standard listed entries at 10 million cells. Example options are shown below.
| Cat. No. | PBMC source | Listed size |
|---|---|---|
| mPB010C-CB | C57BL/6N Mouse PBMCs | 10 million |
| mPB010C-BA | BALB/c Mouse PBMCs | 10 million |
| mPB010C-CD | CD-1 Mouse PBMCs | 10 million |
| rPB010C-SD | SD Rat PBMCs | 10 million |
| rPB010C-WH | Wistar Han Rat PBMCs | 10 million |
| rPB010C-LW | Lewis Rat PBMCs | 10 million |
| cmPB010C | Cynomolgus Monkey PBMCs | 10 million |
| rmPB010C | Rhesus Monkey PBMCs | 10 million |
MileCell’s animal immune-cell offering emphasizes high post-thaw viability, rigorous QC, reliable lot consistency, broad species coverage, stocked inventory and custom options for gender, species, pack size and batch size. The company also lists custom immune-cell isolation by markers including CD3/CD4/CD8, CD14, CD19 and CD56. Availability and specifications for a particular project should be confirmed with the team.
No. CD3 is a pan T-cell marker. PBMCs can also include B cells, monocytes and other mononuclear immune populations.
CD20 identifies a B-cell-associated population in the relevant gate. In the representative rhesus monkey analysis, the reported CD20+ value is 25.83%.
Not in the illustrated rhesus monkey analysis. The reported CD4/CD8 quadrant percentages are labeled within the CD3+ gate.
Only after checking the parent gate for each measurement. Different gates can produce different denominators, so apparent percentages are not automatically additive.
No numerical post-thaw viability threshold for all listed PBMC products is provided here. High post-thaw viability is described as a product feature; lot-specific information should be requested for experimental planning.
CD3, CD4, CD8 and CD20 are most informative when each percentage is tied to its marker definition and parent gate. CD3 gives a view of the T-cell compartment; CD4 and CD8 further resolve phenotypes within it; CD20 adds a complementary B-cell readout. Together, these markers make PBMC profiles more useful for panel design, quality review and downstream immune studies.
For teams building flow-cytometry workflows with animal PBMCs, MileCell offers multiple species and strain options, customizable supply planning and immune-cell isolation support. Start with the scientific endpoint, then request the characterization and lot details most relevant to your assay.
EXPLORE MILECELL PBMCS: Need PBMCs for CD3/CD4/CD8 or CD20 immunophenotyping? Explore animal PBMC options or contact the MileCell team to discuss species selection, available lot data and custom immune-cell isolation. | Info@milecell-bio.com | www.milecell-bio.com